2014
Off My Chest
04/12/14 16:10
Following last post, a new toy in R and R Markdown. I've been playing with scripts written by Francois Michonneau for the Open Tree of Life initiative, and at the same time getting ready to recognize that January 2015 will be my lab's 10th anniversary. We have come a long way! As an initial idea for a lab shirt, I proposed doing something that showed our recent super-nerd status working with R as well as something that recognizes the vast biodiversity that the lab has covered in 10 years. Below is the HTML output from the R Markdown script, which includes the script and the output tree for all the Orders we have worked on!
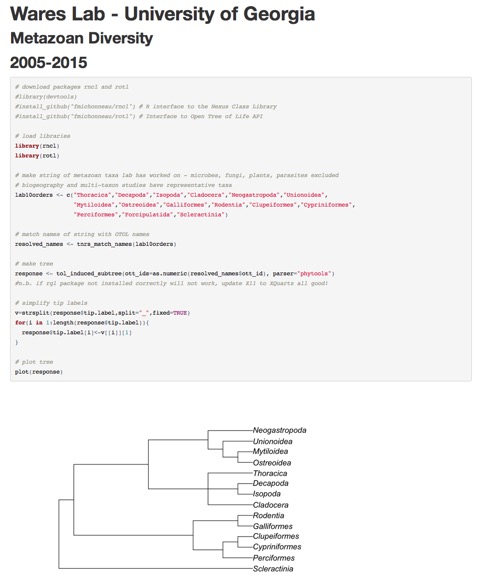
Excellent, interesting, fun code? You bet! Terrible to put tiny letters that are hyper nerdy on the front of our lab T-shirts! You bet! The name tag effect seems like it should be avoided! Still, if you grab the code from the screenshot (or want me to send it to you), you will probably really enjoy seeing what tree data are already out there.
Excellent, interesting, fun code? You bet! Terrible to put tiny letters that are hyper nerdy on the front of our lab T-shirts! You bet! The name tag effect seems like it should be avoided! Still, if you grab the code from the screenshot (or want me to send it to you), you will probably really enjoy seeing what tree data are already out there.
R Markdown
30/10/14 14:08
It has been a minute since I updated this blog! I guess the advent of twitter in my lab's life has given enough room to express what is going on for the most part. However, a more recent technical change has really opened up some changes in how we are doing science in the Wares Lab.
About 6 weeks ago, Scott Chamberlain from rOpenSci visited UGA for the Institute of Bioinformatics seminar. The goal was to talk about how R could be used to help develop repeatable science - in other words, intelligently using analytical packages to help explore data in a way that lets us share the data and the analysis simultaneously. It was a great talk, and gave Katie and Christine and I much to think about.
Only a few weeks prior, postdoc Paula Pappalardo had started showing us RMarkdown (available in RStudio). We are all becoming R users more and more each day, and the confluence of these directions for expressing our research have led to almost everybody in the lab - certainly all of my grads, my postdoc, and myself - writing papers in RMarkdown and learning to use analytical tools in R preferentially over external packages.
I am doing this at least in part so I never have to boot up Windows again ;)
Anyway it is going well. I'm working on an NSF proposal and 3 manuscripts simultaneously in RMarkdown, and what isn't currently available in R packages either indicates I haven't looked hard enough (!) or it forces me to explore the side of programming I actually do enjoy - figuring out how to make a task I do often easier in the future.
An example would be calculating Hudson's Snn statistic. I'm using the PopGenome package, and it calculates Snn - but doesn't appear to perform a permutation test to check the statistical deviation from null expectation. So, I've had to write that myself, which itself is improving my R skills very quickly. Learning to subset and randomly sample efficiently will help with future efforts, and I've also learned a bit about the behavior of Snn too.
The easy way to explain Snn is how Dick Hudson did so in his 2000 Genetics paper: given 2 populations, you query a haplotype and ask what the most similar haplotype is, and if it is in the same location you add a 1, a different location add a 0, divide by the number of comparisons. For 2 locations of equal size, the null expectation is 0.5 (even odds of the most similar haplotype being in the same location) and if all haplotypes from 2 locations are reciprocally monophyletic, then the answer is 1.
Clearly for 4 locations, you would have an expectation of 0.25 for the random distribution, but only if all samples are of equal size. This hadn't really clicked in my head until I had to write the code to do the calculations for the permutation test. It makes sense, however: if 95% of your samples are in one location, then 95% of the time they are likely to have a nearest neighbor in the same location, and the Snn statistic will be biased towards 1 even if the two locations are reciprocally monophyletic.
Fortunately, the way I've programmed the permutation test reflects these unequal sample sizes, and so the answer that comes out in the paper I'm working on today is: meh. Nothing exciting happening here. But for the part of my brain that enjoys coding, very exciting indeed.
(I know I haven't explained the statistic all that well right now: the point was the weird joy of coding. But if anybody has questions about it, why use it, etc. either see the Hudson paper or email me).
Update and Bug
11/07/14 16:38
Hmm. For some reason the text is getting messed up on this blog. Will fix soon, looks like the last 2 posts were affected. Read More...
Live CV
11/07/14 16:28
| Just a note that I’ve decided the CV is dead. A bunch of pieces of paper stapled together, a big list of mostly irrelevant information to your needs. If you want to decide what my impact as a scientist is, it has nothing to do with the names of journals I have published in. It really doesn’t matter what university I’m at - or if I’m at a university at all. If I’m able to sell my ideas, I get grants. That funding helps me travel, collect data, support students. Those efforts let me answer questions. If my answers are useful, people will refer to those publications and data sets and continue the march of science. As such, you don’t need a few pieces of paper stapled together to sift through. I have started my | Live CV page, which you click on and can see the progress of my publications. I will work on adding a location that summarizes my funding sources.
Fed Up / Confession
01/07/14 12:17
I’ll start with the confession. I could have done a better job running a job search this past year. We ended up hiring a spectacular new colleague, | Jill Anderson! And chances are that despite what I’m about to say, we would have ended up with the same result. However, in retrospect what I did wrong was do what everybody has ever done before: pay attention to the “impact” of where papers were published on applicant CVs. I know that is bullshit. You know that is bullshit. There is terrible science in Evolution, there is excellent science in Journal of Crustacean Biology (and vice-versa). We can move beyond the static CV in academia, for which I’ve been told multiple times that my colleagues “can’t read, but they can count.” The important thing is not where you publish, but what impact does it make on the scientific (and larger) community? Once upon a time, you only reached a large audience if you put your work in a “good” journal. Now, however, for most of us our favorite research tool is Google, and it will find the paper you are looking for if it exists! So then the question is, are people finding it and putting your data, results, information, ideas to work? If they are, you are an effective scientist!
Horseshoes
16/06/14 13:36
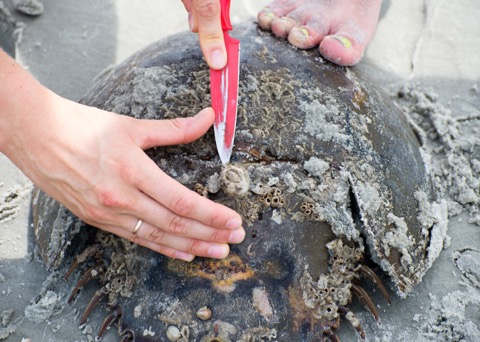
| I had to post one of | Adam Bewick’s photos from my lab’s trip down to Sapelo this past weekend. Nice color, composition, and a little insight into the work that is involved in getting some turtle barnacles for Christine Ewers-Saucedo’s research!
Skipping Out
11/06/14 10:44
It has been awhile since I posted here; you have probably figured out that the allure of Twitter has grabbed me by the collar (wait, I almost never wear anything with a collar...) and at least some of the ideas that I would put here are ending up @wareslab instead. I’ve been surprisingly enthused by what you can find that way. Unlike Facebook, where you are strictly following certain “channels”, Twitter has many broadcasters who are providing information about a particular theme and that theme can cross quickly across users whether you follow them or not. In this way, despite being 5 hours from the nearest ocean to put my feet in, I am regaining connection with some of the intertidal nerds that I love so dearly (or more importantly, the beasts they study).
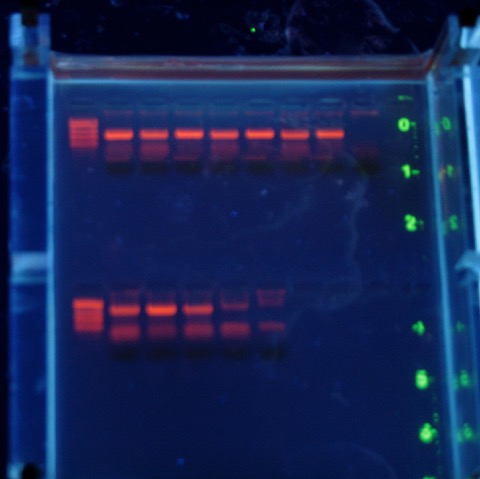
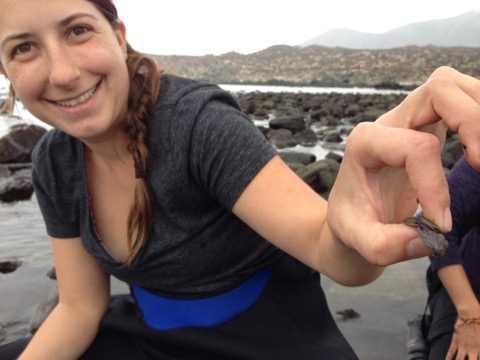
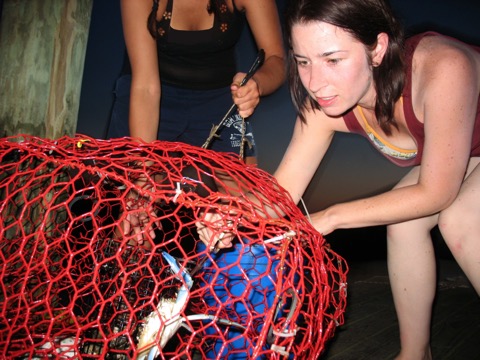
(which reminds me, I didn’t post any of the great pictures I took when in the intertidal just south of Coquimbo at Toloralillo; see chitons above, and Katie with a porcelain crab below) Edit: not sure why the chitons are not showing up, and an old picture of an agarose gel in their place. Such is technology some days. I’ll fix it later.
It’s a good thing to find such connections, even 140 characters at a time. Unfortunately I’ll be missing some genuine in-person connections next week when the #Evol2014 (Evolution) meetings take place in Raleigh, NC. This is generally one of my favorite meetings each summer, primarily for the good connections I’ve made over the nearly 20 years I’ve been a biologist. But, I went last year and gave a reasonable update on my work, saw many people, and this year I have personal (fun) conflicts - choices have to be made. So, keep me posted with the latest from your lab, and if you get a chance (though I think only 3 people read this, none of whom are attending the SSE meeting....) I recommend adding these talks to your slate!
| 1D_206 Modes of Reproduction | Date: Saturday, June 21, 2014 | Time: 3:15 PM - 4:30 PM | Location: 206 | Chair: Andrea Case | 4:15 PM - 4:30 PM | When sex allocation theory and reality meet: Insights from size-specific reproductive investment in an androdioecious barnacle | |||||||
| 1B_306A Biodiversity | Date: Saturday, June 21, 2014 | Time: 10:15 AM - 11:30 AM | Location: 306 A | Chair: Latiffah Zakaria | 10:30 AM - 10:45 AM | Description of a Novel Genetic Marker for Species Identification of Freshwater Mussel Larvae Recovered from Naturally Infested Fish Hosts | |||||||
| 3C_302A Speciation | Date: Monday, June 23, 2014 | Time: 1:30 PM - 2:45 PM | Location: 302 A | Chair: Alycia Lackey | 1:30 PM - 1:45 PM | What drives genetic and phenotypic divergence for Iris hexagona | |||||||
Return to Sapelo
23/04/14 17:15
More travel for the Wares Lab - many of us will be down on Sapelo Island to collect specimens of turtle barnacles (but from horseshoe crabs, rather than turtles) as well as the ribbed mussel Geukensia for a secret stab at adding to the data that John Robinson collected through his association with the LTER many years ago. In addition to being a great weekend for a collecting trip, Christine Ewers will be celebrating her third wedding (to the same great guy, this is the trick with internationally-distributed extended families!) and so we are ready for some dancing on the beach.... congratulations Christine and Daniel!
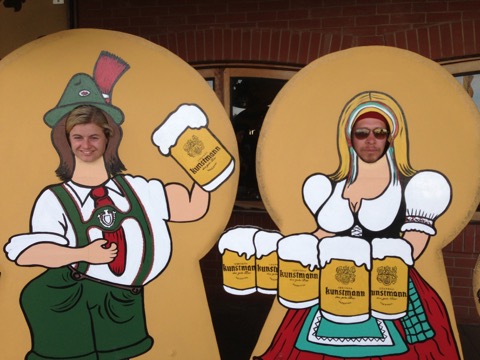
pic taken at the Kunstmann brewery in Valdivia, Chile!
Also note that after posting a grand total of 1 thing to Google+, I came to my senses at the Benthic Ecology Meeting this year and began using Twitter instead to communicate the short bursts of excitement that come along with running a great lab like this one. So, while I will continue adding to this page every few weeks (months?) with longer and more picturesque updates, don’t be afraid to check in with the little bird button up above.
Return to Coquimbo
10/04/14 10:14
Next week half of the Wares Lab will be in Chile again, starting a project with colleague Pilar Haye on the mussels and squirts of the Chilean intertidal! I haven’t been to Coquimbo since late 2011, when I taught in a phylogeography workshop at Universidad Católica del Norte and sampled some intertidal spots as well. Hoping for a good low tide to learn the mussels of central Chile better!
Finally :)
19/03/14 15:18
Ten years ago, Sabrina Pankey started working with me at UC Davis on a project to explore genetic diversity in the beautiful Pacific seastar Pisaster ochraceus. That work got the cover of The Biological Bulletin in 2006, and she came to Georgia to work in my lab as a technician. In her two years here, she got a publication on barnacle phylogenetics as well as a really nice Journal of Evolutionary Biology paper on overdominant marker diversity in Pisaster. She left a great legacy of hard work and fun play in my lab, and went on to work with Todd Oakley at UCSB. She’s done alright in that time: last year when I lectured “Intro Evolution” I used a text that included a few figures from her work with Todd (showing you how generally awesome that work is considered), and she has already set a general course of awesomeness in her career. I’m writing this little post not just to applaud Sabrina for that work, but I’ve found out she is defending her Ph.D. today! Congratulations Sabrina!
Seahawks
11/03/14 11:15
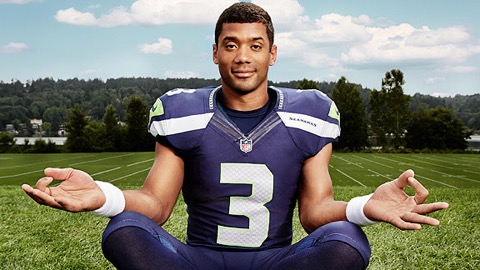
My son loves the Seattle Seahawks, and so in my house we notice when something about the Seahawks is in the news. My wife Jenny - a health care professional herself - just came across this story the other day on ESPN about the relaxed atmosphere instilled in their practice camp, including meditation and yoga as part of their weekly or even daily routine.
Almost on the same day, I had come across a series of TED talks about productivity in the workplace and how to best foster it. This is both for my own growth as a professional, trying not to get too caught up in the administrative tangle of a university while maintaining my trajectory as a biologist, as well as figuring out how best to work with students and colleagues.
One of the talks in particular was about leadership and productivity, and how engendering pleasant work environments - positive attitude, happy workers - leads to higher productivity, rather than the other way around. It triggered a lot of thoughts about how we use these ideas in graduate training, something that to me is a combination of medieval apprenticeship and modern-day productivity. We are training people how to do what we do, but we are also trying to get things done with them and through them. So how do we make this training experience best for students and mentors alike?
I try but I’m sure it could improve. I think I have happy students - at least, as happy as a grad student can be with all of the stresses of finishing a thesis and juggling the real life outside of these walls! But I know that as a department, we haven’t given much thought to how to work on the morale of the troops, how to calmly handle the fears and insecurities of generating ideas and backing those ideas up with data. This might be a good thing to think about before our next departmental retreat.
Representation
19/02/14 12:04
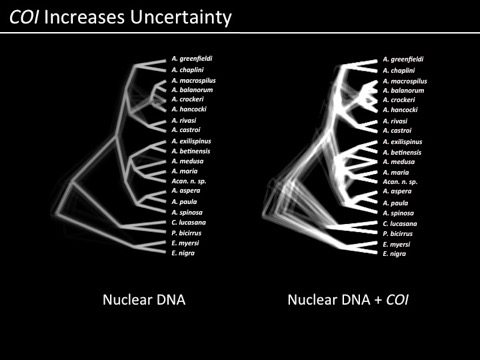
When I first started doing science, visualization of our data and results was a bit easier. Sequence a gene from 20-30 individuals, generate a phylogenetic hypothesis, make it look pretty, Figure 1. As we have moved to information from more and more loci (or greater numbers of samples, or any other factor of additional complexity), there have been ways developed to summarize the results visually for the purposes of proving to the audience of a journal article that you are on the right track in terms of interpretation. For example, former postdoc (and now faculty at Texas A&M - Galveston) Ron Eytan used these images to show which parts of a phylogeny were consistently supported and which were not (an image that overlays many reconstructions of a phylogeny from the same data):
and we are now becoming familiar with things like transcriptome heat maps to illustrate over/under expression of particular genes:
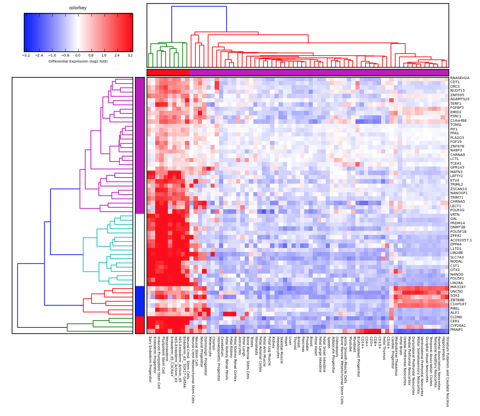
and to an extent, we have just become accustomed to more complicated representations of data and results residing only as online supplemental files. In other words, often the most important components of science are no longer able to be represented in the standard peer-reviewed journal article. We are at this point often having to take into consideration representation of science through multiple filters: how will it communicate to the audience? what if that audience is looking only at a photocopy, or black-and-white print of my article? what if that audience is unable to afford the journal I submit to?
but what I’m grappling with today, is what if there is no single view, even if it is a figure with multiple panels, that can explain your results the same way that having an animation, in particular an interactive animation, could do?
the above is a representation of fitting in silico particles (representing barnacle larvae) to a coastal oceanographic system with environmental selection on the two lineages of barnacle that we are studying. The bottom plot shows frequencies of the northern and southern types plotted against latitude, and as the movie plays it shows how the oceanography and selection interact to fit simulated data to empirical data. This alone is a daunting amount of information. But we can vary so many parameters: depth of larval release, time in the water column, strength of selection, cost functions, the fit to over 100 distinct loci for which we have data, inter annual variation. There is almost no way to represent the complexity of this story - adequately! - in the illustrations we typically put together for a science publication. So it will probably end up that many of these movies will be online supplements. But I wonder: when will our expectations of “publishing” science catch up with the technology with which we DO science?
and we are now becoming familiar with things like transcriptome heat maps to illustrate over/under expression of particular genes:
and to an extent, we have just become accustomed to more complicated representations of data and results residing only as online supplemental files. In other words, often the most important components of science are no longer able to be represented in the standard peer-reviewed journal article. We are at this point often having to take into consideration representation of science through multiple filters: how will it communicate to the audience? what if that audience is looking only at a photocopy, or black-and-white print of my article? what if that audience is unable to afford the journal I submit to?
but what I’m grappling with today, is what if there is no single view, even if it is a figure with multiple panels, that can explain your results the same way that having an animation, in particular an interactive animation, could do?
the above is a representation of fitting in silico particles (representing barnacle larvae) to a coastal oceanographic system with environmental selection on the two lineages of barnacle that we are studying. The bottom plot shows frequencies of the northern and southern types plotted against latitude, and as the movie plays it shows how the oceanography and selection interact to fit simulated data to empirical data. This alone is a daunting amount of information. But we can vary so many parameters: depth of larval release, time in the water column, strength of selection, cost functions, the fit to over 100 distinct loci for which we have data, inter annual variation. There is almost no way to represent the complexity of this story - adequately! - in the illustrations we typically put together for a science publication. So it will probably end up that many of these movies will be online supplements. But I wonder: when will our expectations of “publishing” science catch up with the technology with which we DO science?
Climate Change
14/02/14 09:05
The University of Georgia has been more or less shut down this week by a snow/ice storm. That isn’t so out of place in February. However, anybody reading this will recognize that weather patterns have been more erratic, more extreme, more remarkable, in recent years. Some areas have drought. Some areas have flooding. Some areas are colder than usual; the Arctic is 20° warmer than usual for this time of year. This is climate change - many observations about the weather, each one of them insignificant, but overall adding up to a horrifying understanding that we humans are experiencing a change of this planet with no historical precedent, and it is - here is where people tend to start disagreeing - our fault.
The same sort of issue comes up when discussing evolution. Scientists like the ones in my lab, my department, my university have identified millions of individual facts about genetic and taxonomic and trait diversity on our planet, in the species we know and love, and individually these facts mean next to nothing. Who cares if the nucleotide diversity of crayfish in Town Spring, Athens, Georgia, is 0.0? Who cares if it is nearly 1% in yellowfin shiners in Hunnicutt Creek? But if you compile all of these facts, they support evolutionary theory as the most straightforward way to describe diversity and its distribution on our planet.
This is why our current hire at UGA, in the Department of Genetics and the Odum School of Ecology, is going to be a scientist who focuses on the interplay of these two disciplines. How do organisms, how will organisms, respond as the environment changes more rapidly than it has in the past? What predictions can we make that will influence policy, and perhaps give people the opportunity to focus on more sustainable approaches to work and life? These are big questions, but engaging ones.
Web 2.0
22/01/14 08:49
Google+
Testing things out. Soon we will be adding a Google+ feed to the site to find a balance between the mundanity of Facebook and tech-minimalism of Twitter, as well as making for something that lets us share other people’s cool results, ideas, software, projects, and so on.
I’ve also updated the website considerably as I’m sure you can now see. The old one was fine, but busy in a way that made it look dated to me. What, after all, is the purpose of a research lab website - especially for a small program like mine? Make sure people can find information about what we do, who we are, what papers we have published, whether we are taking on new students or postdocs, and other announcements. The old one had more information than anybody ever really needs, or they can email to get more information.
I’ll be cleaning it up more in the coming weeks, and pondering the social media world. As I said, I learn a lot from colleagues on Twitter but it seems to be a quirky club: it can amplify the signal of some work, but is in general still not as visually grepable as the way information is organized in a browser app like G+. We’ll see.