phylogeography
Answers Lead to Questions
10/02/11 09:30

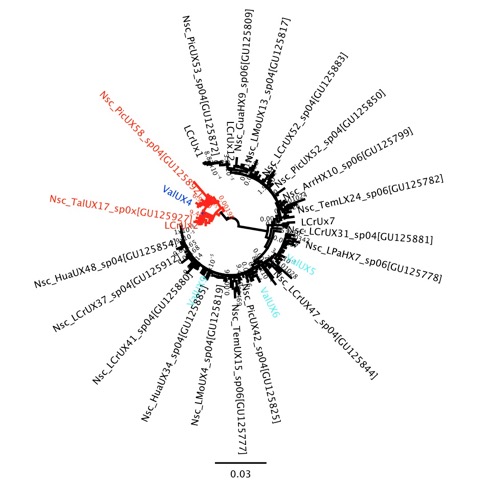
There is nothing too clear about the figure I’ve pasted in here, that is partly intentional because I’m still figuring some things out. But, this figure represents the first new step in understanding the genetic/species patterns along the coast of Chile that my lab has taken since our paper (Zakas et al. 2009) came out in MEPS. New lab technician Kelly Laughlin has been coming up to speed very quickly over the past 4 weeks, and the first sequence data she collected included about 24 individuals of Notochthamalus from near Valdivia, Chile. This is about 500km further south than our survey in the past, and I wondered if the genetic cline that we observed would go to fixation for the southern haplogroup. In the image above, the southern haplogroup is red, the northern haplogroup is black, and in blue (only a small number are shown because of the scale of the tree) are individuals from Valdivia (6 in the red clade, 12 in the black). What this tells me is that the relative B/A frequency in Valdivia is exactly the same (about 1/3) as at Pichilemu, Las Cruces, and Punta Talca far to the north.
This suggests that all of the focus can return to the area around 31°S latitude, where there are tremendous shifts in physical oceanography, ecology, biogeography, and population genetics. But it is also a puzzling scenario for our tiny barnacle. My interpretation is that we are dealing with the equivalent of two incipient species being formed from one, and it remains to be seen what micromicrohabitat differences they have, but the ‘southern’ one simply doesn’t find that suitable microhabitat to the north of 31°S very often. Our upcoming genomic scan will help point us toward the factors that may be maintaining or promoting this differentiation, similar to John Grahame’s exciting work on intertidal Littorinids.